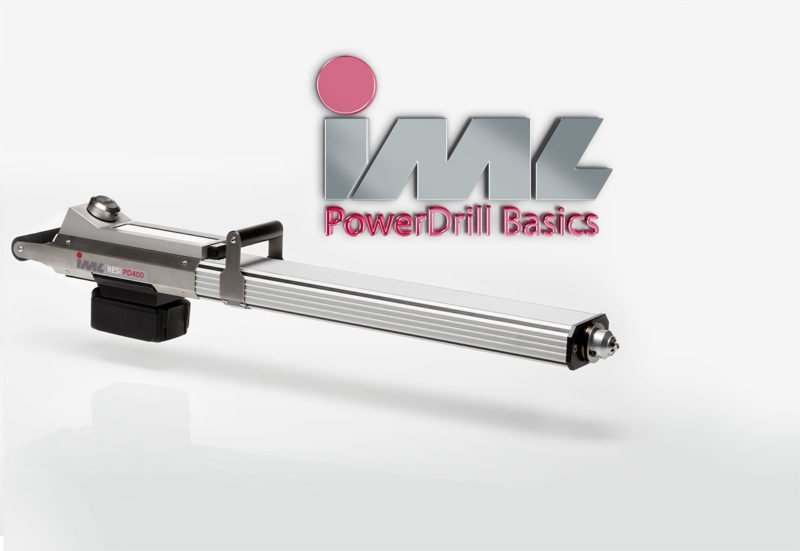
The drill resistance measuring device IML-RESI PowerDrill shows the measuring curve during the measurement on the screen and saves the results for later analysis. You can retrieve the measurement results anytime and view them on the screen as long as they are saved on the device.
How to start and end a measurement
First, ensure that the tip of the device is firmly pressed against the wood. A measurement can be started only once the safety switch is activated. When you wish to start a new measurement, press the red button. On the screen, you can see the progression of the measuring curve in real time. To end the measurement, press either the red or black button. The device saves the measurement automatically.
How to display saved measurements
In the main menu, you will find the magnifier symbol on the left. Select this symbol using the navigation dial and press the navigation dial to confirm your selection. The menu that is now displayed shows all data of the last measurement. Navigate to the “Profile” button and press the navigation dial. Thereupon the measuring curve is displayed.
How to change the graphics settings of the measuring curve
In the main menu, select the symbol for measurement profile, located on the left next to the magnifier symbol. This is how you get to the measuring curve directly. Now, when you press and hold the black button, the tool bar opens and you can adjust the graphics settings.
- Via the “Selection” button, you can change the measuring profile by turning the navigation dial. One push on the navigation dial takes you back one step in the menu.
- If you select the button “fill”, you can fill the area below the curve or delete the filling.
- The button “Curve“ allows you to determine which curve is displayed on the screen. Drill resistance curve and feed speed curve may be displayed independently or together.
Special feature: scale of measuring curves
To the extent you have activated the supplementary module “SCL” , you can adjust the scaling of the X and Y axes via the buttons “scal. X” and “scal. Y”. By selecting “ok”, you can confirm your settings and leave the graphics settings feature. To return to the main menu, press and hold the navigation dial. Further information on the scaling package for measuring curves can be found here in reference to the supplementary module: scaling package SCL.

